Estimating the number of unidentified cases of COVID-19 in Italy as of March 31st using South Korean and Chinese mortality rates
Andrea Molle, Chapman University, California USA.
The global panic around the COVID-19 epidemic is fed by alarming estimates of its mortality rate. Italy in particular is watched upon with great anxiety as a potential global scale scenario with a mortality rate currently estimated in the 10%. Using the mortality rates by age group identified in China and South Korea as theoretical mortality rates and comparing them to the deceased numbers in Italy in order to estimate the number of unidentified COVID-19 cases, I suggest that as many of 500,000 infected, asymptomatic, individuals are not included in the official count. This in return, results in the over estimation of the overall gross mortality rate which probably falls around 2%. There are strategical public policy implications to our quarantine and mitigation strategies.
The official number of cases and deaths from COVID-19 in Italy represents a mystery for the disease seems to have taken on a more aggressive and lethal form than in other countries, with a mortality rate currently estimated in the 10%. In this research note, I assume that this is a statistical artifact and a consequence of extremely unreliable data on the true total number of cases in Italy. First, there is one main factor which contributes to an underestimation of the total case numbers. Italy appears to have performed fewer tests than other countries and, more importantly, it is testing only individuals who experience severe symptoms, and who ultimately require hospitalization. Many of the currently infected, asymptomatic, people are therefore not included in the official count. Secondly, in more acute cases, there is a lag of about 8 to 10 days between the initial onset of the symptoms and the death of the patient. All this clearly results in the over estimation of the overall mortality rate.
Here I suggest that is possible to get a better understanding of the actual spread of the contagion in Italy using the mortality rates by age group identified in China and South Korea as theoretical mortality rates and compare them to the deceased numbers in Italy in order to estimate the number of unidentified COVID-19 cases.
Estimates of Total Cases
First we need to consider mortality rates in China using the most recent data available [1]. Being the first country to experience an outbreak of COVID-19, it is now probably the closest country to having a conclusive outcome for most of its active cases. Chinese estimates are, however, considered highly problematic and present a staggering difference between the mortality rates in Wuhan and the rest of the country. Therefore, we advise extreme caution if using them as a reference.
The following table (1) computes estimates of the total cases in Italy using Chinese mortality rates as a reference. Using the official number of deaths by age group reported by the Italian Ministry of Health at March 30th [3] [4] (column B of the table), we estimate the number of true cases by age group (column D) assuming that Italy has the same mortality by age group as China. This is done by dividing the number of deaths in each age group by the corresponding theoretical mortality rate. By subtracting the number of official cases (column C) from them, we determine the estimated number of infected people who are not yet identified (column F). In comparing the latter with the official Italian data, we assume that the more the detected lethality differs from the theoretical mortality, the more infected people are not yet identified.
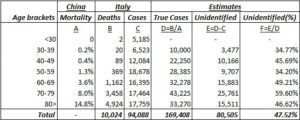
Table 1 – Estimated true cases (Chinese mortality reference)
For example, if we want to estimate the true number of infected in the 70 to 79 bracket, we divide the number of deaths officially recorded for this age group (3,458) by the corresponding mortality estimated from the Chinese data (8%) thus obtaining a projection of 43,225 cases which results in 25,761 more cases than the 17,464 currently detected. By repeating this for each age brackets, with the exception of the <30 bracket for which we don’t have mortality data available, we estimate that the total number of true cases is 169,408.
Let’s now consider mortality rates in South Korea as of March 30th [2]. The East-Asian country has the most accurate estimates of the true size of the infection due to its extensive testing, it has already reached the cases peak, and is not far from having a conclusive outcome for most of its currently active cases. Because of the more reliable data, assuming that the standards for reporting cases outcomes are the same across both countries and its structural and demographical similarities with Italy, we recommend using the estimates based on the Korean case. In other words, the mortality rates by age group in South Korea represent a better approximation than China of what the true Italian mortality rates should be. Adopting the same procedure as we did with China and results are shown in the following table.
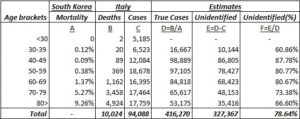
Table 2 – Estimated true cases (South Korea mortality reference)
Following the previous example, in order to estimate the true number of infected in the 70 to 79 bracket using the South Korean mortality rates, we divide the number of deaths officially recorded for this age group (3,458) by the corresponding mortality estimated from Korean data (5.27%) thus obtaining a projection of 65,617 cases which results in 48,153 more case than the 17,464 currently detected. By repeating this for each age brackets, with the exception of the <30 bracket for which we don’t have mortality data available, we estimate this time that the total number of true cases could be as large as 416,270.
Finally, to obtain a more accurate estimate of unidentified cases, we can factor the window from contagion to death in our calculations. I computed an estimate of future deaths by regressing the current distribution of cases with a fatal outcome up to March 30th. I then opted for a conservative prediction of 14,574 total deaths by April 5th and redistributed them across age brackets using the same proportions as in the original Italian data.
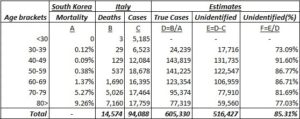
Table 3 – Estimated true cases with projected deaths (South Korea mortality reference; death cases adjusted for onset-to-death window)
Once again, if we use the resulting distribution to estimate the true number of infected in the 70 to 79 bracket using the South Korean mortality rates and we divide the number of deaths for this age group (5,026) by the corresponding mortality from the Korean data (5.27%) we obtain a projection of 95,374 cases which results in 77,910 more cases than the 17,464 currently detected. By repeating this for each age brackets, with the exception of the <30 bracket for which we don’t have mortality data available, we estimate that the total number of true cases could be as large as 605,330.
The validity of our assumptions and the robustness of our estimates are confirmed by the resulting mortality rate of 2.408% that is similar to the Case Fatality Rate at 10 days (2.45%) computed by dividing the number of death at March 30th (812) by the cases active at the beginning of March 20th (33,190) [5]. The analysis shows that about 78.64 to 85.31% of cases haven’t been identified and thus between 327,367 and 516,427 infected people are still potentially contagious. Although these figures should be taken cautiously, the size of the difference between identified and unidentified cases remains alarming. Moreover, as shown in the following table (4), if the true mortality rate in Italy is the same as North Korea, the age breakdown suggests that more than 70% of undetected cases should be among the active population, between 40 – 69 years old.

Table 4 – Proportion of unidentified cases per age bracket (South Korea mortality reference; current cases vs. adjusted for onset-to-death window)
Conclusions
Many researchers are now suggesting the importance of comorbidities in determine the severity and the outcome of the infection by COVID-19. Having an estimate of undetected cases could help the Italian government, and other governments now facing the same scenario, to better investigate the spread of the virus among their population. Thus, extending aimed testing to underrepresented age brackets and, for example by targeting individuals with comorbidities, increasing the effectiveness of their public health strategies in facing the pandemic as well as mitigating the panic in the public.
About the Author
Andrea Molle, Department of Political Science and Institute for the Study of Religion, Economics and Society, Chapman University, Orange, California, 92866 USA
References
[1] The Novel Coronavirus Pneumonia Emergency Response Epidemiology Team. The Epidemiological Characteristics of an Outbreak of 2019 Novel Coronavirus Diseases (COVID-19) — China, 2020[J]. China CDC Weekly, 2020, 2(8): 113-122.
[2] Age distribution of coronavirus (COVID-19) cases in South Korea as of March 30, 2020, Korean Center for Disease Control. Retrieved through link [Retrieved on March 30th, 2020. The site updates regularly, mortality rates are subject to change].
[3] Characteristics of COVID-19 patients dying in Italy. Report based on available data on March 30th, 2020, Istituto Superiore di Sanita’: Link [Retrieved on March 30th, 2020. The site updates regularly, mortality rates are subject to change].
[4] COVID-19 Italia – Monitoraggio situazione by Protezione Civile: Link [Retrieved on March 30th, 2020. The site updates regularly, case numbers are subject to change].
[5] A. C. Ghani, C. A. Donnelly, D. R. Cox, J. T. Griffin, C. Fraser, T. H. Lam, L. M. Ho, W. S. Chan, R. M. Anderson, A. J. Hedley, G. M. Leung, Methods for Estimating the Case Fatality Ratio for a Novel, Emerging Infectious Disease, American Journal of Epidemiology, Volume 162, Issue 5, 1 September 2005, Pages 479–486, Link.
Comorbidity Factors (such as heart disease and diabetes) Influence COVID-19 Mortality More Than Age (Chapman University)
by Steven Gjerstad and Andrea Molle – Chapman University, USA
last update 2020.03.30
“It is an extremely important finding, not only because it allows for better decisions in the triage phase. But also because in the following phases, starting from the so-called phase 2 up to the production and distribution of a vaccine, it will be essential to make decisions aimed at protecting those who are the most at risk of serious consequences. Moreover, before the vaccine is distributed, individuals with hypertension, diabetes, heart disease, if not already developed immunity, will necessarily have to be closely monitored. Not only as they are at higher risk, but above all because if the disease is reactivating, we will see it in those with comorbidities, since healthy individuals tend to be asymptomatic and therefore could spread the virus silently.”
THE RESEARCH
The global reaction to the COVID-19 epidemic has rested on a critical assumption, that all persons over the age of 60 face an unacceptable risk of death if they are infected with the virus. Recent evidence from a detailed analysis of individual Chinese, American, and Italian patient data clearly indicates that this assumption is incorrect. Our research indicates that only 0.8% of all coronavirus-related deaths in Italy involved otherwise healthy individuals. The remaining 99.2% of deaths involved individuals who had at least one, and often at least 3 other illness factors. There are significant public policy implications to our quarantine and triage strategies.
Mortality from COVID-19 increases substantially with comorbidity factors, such as heart disease, hypertension, diabetes, stroke, and liver disease. After we control for the high incidence of comorbidity factors among the elderly, we find that mortality from coVid-19 does not vary much with age.
The coronavirus epidemic in Italy has strained hospital resources, including ICU beds and ventilators for those experiencing acute respiratory failure. Studies of COVID-19 in China [1], Italy [2], and the United States [3] show that fatality rates increase rapidly with age, especially beyond age 60. The same studies and others also show that fatalities increase substantially with comorbidity factors, such as heart disease, hypertension, diabetes, stroke, and liver disease [1, 4]. These morbidity factors are known to increase rapidly with age [5, 6, 7]. This paper demonstrates that once we control for comorbidity factors, age has a minor effect on COVID-19 mortality. Among the elderly the higher incidence of heart disease, diabetes, hypertension, and other comorbidity factors lead to their increased mortality form COVID-19. The distinction is an important one for the critical triage decisions that are required now. If it is the comorbidity factors that lead to death with COVID-19 patients and not age, then triage will be more effective if healthy elderly people are provided with treatment, since their chances of survival are good.
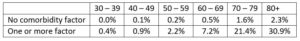
We examine 73,780 cases of COVID-19 and 6,801 deaths from COVID-19 in Italy through March 26, 2020. Based on estimates of the prevalence of comorbidity factors in Italy by age group and on the frequency of COVID-19 cases and mortality rates for age groups, we estimate the percentage of patients with and without morbidity factor that would be expected to die, first assuming that those with and without comorbidity factors are equally likely to die. Subsequently, we use a maximum likelihood estimate to get mortality probabilities for people in each age group, with and without comorbidity conditions. COVID-19 patients with comorbidity conditions are 10.5 times as likely to die than those without a comorbidity condition. For example, an Italian COVID-19 patient between 70 and 79 years old with no comorbidity factor has about a 1.6% chance of death, whereas a 70 to 79 year-old patient with a comorbidity condition has a 21.4% chance of death.
Triage decisions based on patient age do not account for the large differences between the prognosis for patients with and without morbidity factors. As medical resources become strained during the epidemic, it will be important to take account of the probabilities of survival for patients with different medical histories.
Analysis
Table 1 in [4] shows that 50.7% of the fatal cases of COVID-19 in Italy through March 26 had 3 or more of the comorbidity factors. Another 25.9% had 2 of these factors, and 21.3% had one factor. Only 2.1% had no factor. This last statistic is important. If age alone were an independent factor that leads to high mortality, then – we will demonstrate in this paper – there would be many more deaths among those who are elderly but otherwise healthy. In other words, the 2.1% frequency of no comorbidity factors would be much higher.
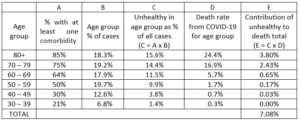
Tabella 1 in [8] shows that 19.2% of 73,780 COVID-19 cases in Italy through 4 p.m. on 26 March were among people age 70 to 79. From Tavola 7 in [7], we can infer that close to 25% of those people have none of the comorbidity conditions. We take death rates for the age groups from Tabella 1 in [8]. We consider the hypothesis that healthy people in each age group are as likely to die as those with 1 or more comorbidity condition. This hypothesis will lead us to the conclusion that there should be approximately 10.5 times as many people with no comorbidity factors as the number that are shown in Table 1 in [4].
People between 70 and 79 comprise 19.2% of the cases, and 25% of those have no comorbidity condition, so healthy people 70 – 79 years old are 4.8% of the cases. If healthy people between the ages of 70 and 79 are as susceptible to death from COVID-19 as those in their age group who have comorbidity conditions, then their death rate should be 16.9%, like their age group. If they were dying at the same rate as their age group, the fraction of all cases who would be people between 70 and 79 and have no comorbidity factor would be 0.048 x 0.1569 = 0.0081. Now we repeat this analysis for the remaining age groups and fill out Table 1.
Table 1: Column E shows the percentage of the 73,780 total cases that would be healthy people (i.e., no comorbidity factor) in their age group and would die from COVID-19.
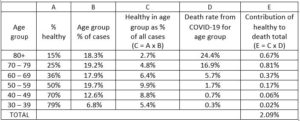
The total number of deaths that we would expect for people with no comorbidity factor would be this expected death frequency times the number of cases, which is 0.0209 x 73,780 = 1,542.
Table 2: Column E shows the percentage of the 73,780 cases in each age group that would die who have one or more comorbidity factor.
We now carry out a similar calculation in Table 2, but we consider here those people who have one or more comorbidity factor. This calculation shows that 7.08% of the total cases should be people with one or more comorbidity factor who died. That would result in 0.0708 x 73,780 = 5,223 deaths. As a check, total predicted deaths are 6,765. The total number of deaths from Tabella 1 in [8] where we get our total number of cases and our lethality factors for age groups (Column D) is 6,801.3
Our hypothesis that healthy people in each age group have the same probability of dying from COVID-19 leads us to the conclusion that of our estimated 6,765 deceased, 1,542 or 22.8% should have no comorbidity factor. Yet Tabella 1 in [4] shows that only 2.11% had no comorbidity factor. Consequently, the hypothesis that the probability of dying is the same for all people in an age group regardless of their comorbidity factors leads to the conclusion that there would be about 10.8 times as many deaths among those with no comorbidity factor than what we see in the sample of deceased persons in Tabella 1 in [4].
This analysis can be augmented by assuming different probabilities of mortality for those with and without comorbidity factors. If we multiply every element in Column D in Table 1 by 0.0925 we would get 143 deaths among those with no comorbidity factor. If we multiple every element in Column D, Table 2 by 1.2677 we would get 6,622 deaths among those with one or more comorbidity factor. We would then have 143/6,765 = 2.11% of the deceased having no comorbidity factor, as in Tabella 1 in [4]. The probabilities of death are then those in Table 3.
Table 3: These mortality probabilities produce fatalities in each age group that match total fatalities and match the frequency of comorbidities found in Tabella 1 in [4].
From this we conclude that age is most likely only a moderate factor leading to COVID-19 mortality. Of course, healthy elderly patients are not dying in large numbers from COVID-19, so triage decisions that ignore the elderly healthy are not likely to lead to large numbers of deaths within this group. These patients are likely to recover, but they are likely to recover more quickly and with less physical damage if they are provided treatment. They also are unlikely to require critical care for much longer than a healthy young person, since like the healthy young, they are recovering. For these reasons, we believe that triage decisions should be made without regard to a patient’s age.
About the authors
Steven Gjerstad, PhD, Economic Science Institute, Chapman University, 1 University Drive, Orange, California, 92866 USA, E-mail: gjerstad@chapman.edu; Tel: 714-628-7282
Andrea Molle, PhD, Institute for the Study of Religion, Economics and Society, Chapman University, Orange, California, 92866 USA
References
[1] Wu, Zunyou and Jennifer M. McGoogan, “Characteristics of and Important Lessons from the Coronavirus Disease 2019 (COVID-19) Outbreak in China,” Journal of the American Medical Association, Feb. 24, 2020.
[2] Livingston, Edward and Karen Bucher, “Coronavirus Disease 2019 (COVID-19) in Italy,” Journal of the American Medical Association, March 17, 2020.
[3] “Severe Outcomes Among Patients with Coronavirus Disease 2019 (COVID-19) — United States, February 12–March 16, 2020.” Centers for Disease Control, Morbidity and Mortality Weekly Report (MMWR), 18 March 2020. DOI: http://dx.doi.org/10.15585/mmwr.mm6912e2
[4] “Report sulle caratteristiche dei pazienti deceduti positivi a COVID-19 in Italia,” Instituto Superiore di Sanita, 20 Marzo 2020.
[5] “Age-adjusted percentages of selected circulatory diseases among adults,” Centers for Disease Control, Summary Health Statistics: National Health Interview Survey, 2018. https://ftp.cdc.gov/pub/Health_Statistics/NCHS/NHIS/SHS/2018_SHS_Table_A-1.pdf
[6] “Diabetes prevalence and glycemic control among adults,” Centers for Disease Control, 2018. https://www.cdc.gov/nchs/data/hus/2015/040.pdf
[7] “Patologie croniche in costante aumento in Italia con incremento della spesa sanitaria. La cronicità non colpisce tutti allo stesso modo: si confermano le diseguaglianze di genere, territoriali, culturali e socio economiche,” Istituto di Sanità Pubblica, Roma, 15 febbraio 2019. https://www.osservatoriosullasalute.it/wp-content/uploads/2019/02/Focus-1-Osservasalute-La- cronicità-in-Italia-feb-2019.pdf
[8] “Epidemia COVID-19 Aggiornamento nazionale,” Istituto Superiore di Sanità (ISS), Roma, 26 Marzo 2020.


 per la sicurezza nazionale e la cooperazione regionale")